Uncategorized

How-To: File hunt for OBIEE GUI changes
Among the questions I receive and that frequently come up on OTN, treated in blog posts etc. are questions pertaining to: How do I change a part of the GUI of OBIEE? Now in this post you’ll find the answer to that specific question, but
the point here today isn’t simply to say “do X in Y”, but rather “how do
you get to know that you need to change X in Y?”.
Mind you, I’m doing these changes quick and dirty to make them instantly visible. The proper way is to create and deploy your own style + skin package within which you do those changes (or alternative post over at my buddies at RittmanMead as well as my own one)!

The single most important things when working with anything relating to the GUI is: Firefox with Firebug (or Internet Explorer with F12 Developer Tools)
The target is to move the image in the title view to the right of the actual title text.
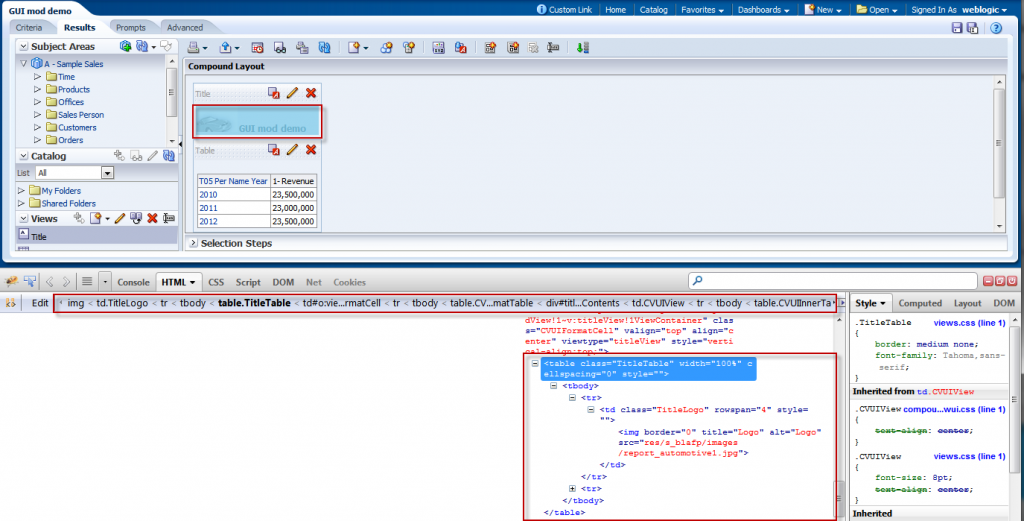
In order to understand what actually needs to be touched in terms of files you right-click on the logo and choose “Inspect Element with Firebug”.
This will show you the detailed information on the object within the HTML with its style inheritance through the CSS and all the bits you need to dig further.
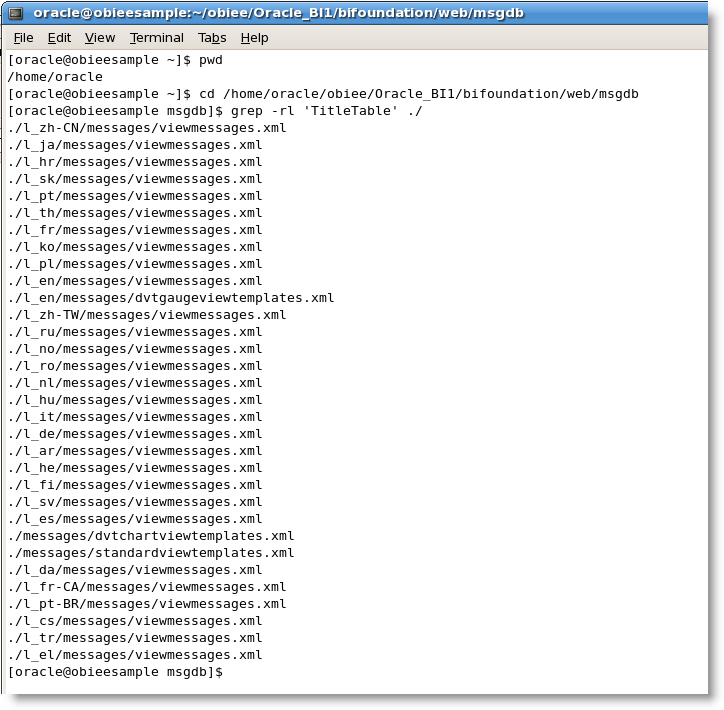
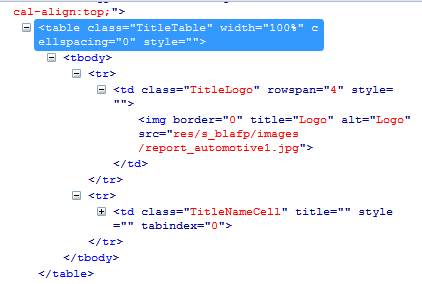
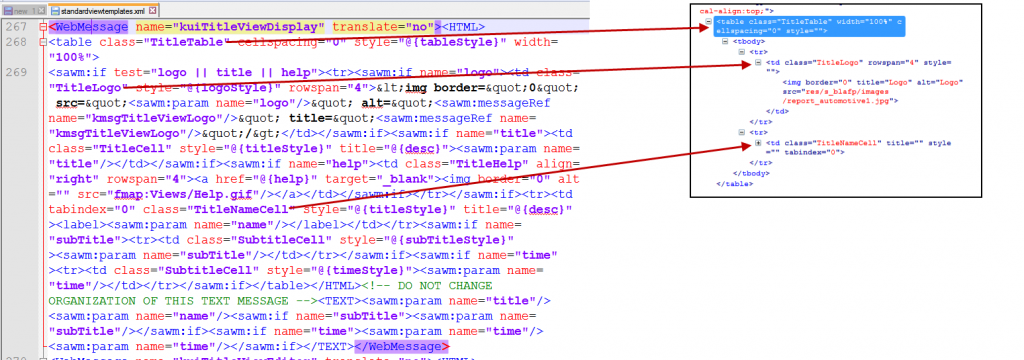
In this case you see that the table class is “TitleTable” (the two tr’s you see inside are once the logo and once the title text). In order to find the file which controls this, do a search within the vanilla msgdb folder. In this example I’m using the SampleApp v309:
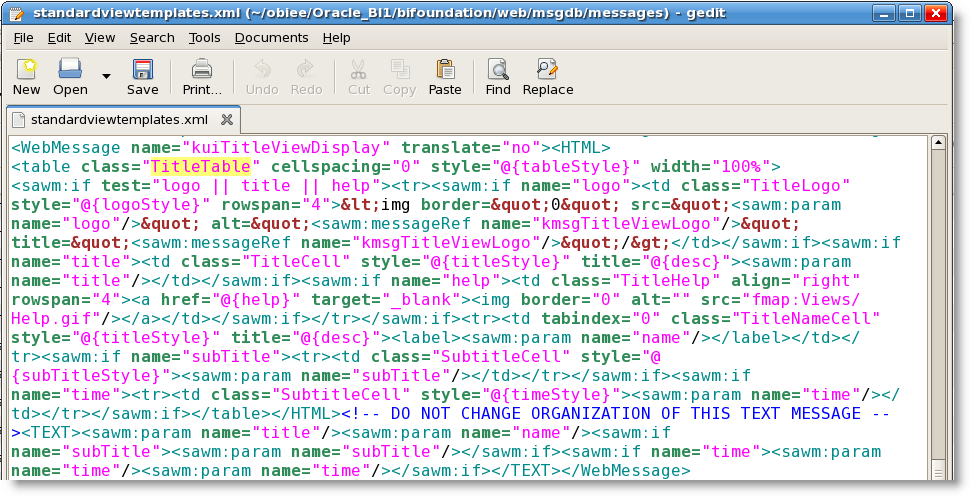
“viewmessages.xml” can be disregarded since it doesn’t figure in the actual rendering process, but “standardviewtemplates.xml” is the one we really want.
Now that may look a bit unreadable at first glance, but following the Firebug output above, one can quickly see how the XML controls GUI generation by matching the standardviewtemplates.xml content with the page HTML:
 
Once this matching is done, you can use an editor like Notepad++ to clean the XML (indent, highlight, collapsible etc) to make the standardviewtemplates.xml more readable and manageable.
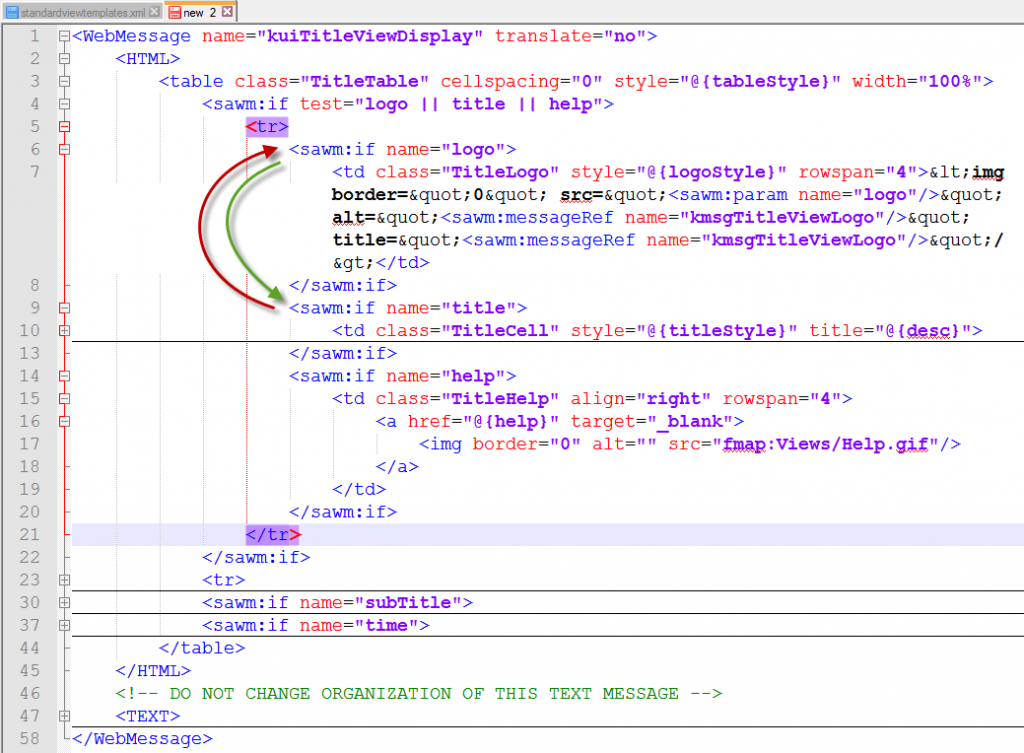
Target now is to switch the positions of the title logo and the title text, but the logo before the help icon since the help “?” should still be at the far right-hand side.
So a switch of the two respective “sawm:if name=…” is necessary…
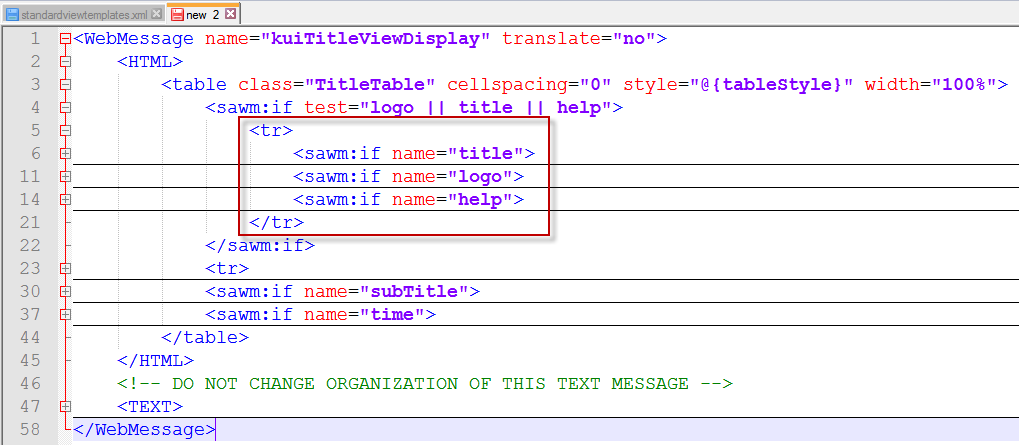
…in order to get to a situation where the sawm:if’s are in the order desired: title, logo and then help:
In my case I overwrite the existing central (vanilla) standardviewtemplates.xml with the modified version, but as said initially, I strongly suggest that all such changes should be done in custom style+skin packages!

After a bounce of the presentation server service the modified GUI is up and ready:

Cheers!

Uncategorized

Currently, I’m a happy camper since two blog posts were recently written on absolutely fundamental subjects which for me fall into the category: “Know and understand these concepts or just please don’t touch any OBIEE RPD, thanks.”

First post is from Andy Rocha over at RittmanMead and concerns LTSs and outer join pruning:
http://www.rittmanmead.com/2013/09/outer-join-lts-pruning-its-here/

Second one is from Jeff McQuigg on dimensionsal hierarchies and – by extension – the “dreaded” content level tab:
http://greatobi.wordpress.com/2013/09/10/the-single-most-important-thing-to-know-about-the-obi-rpd/

Both of these posts touch on subjects which are the subject of questions about 10 times a week on forums.oracle.com and comunities.oracle.com …each!
LTS modelling (one vs several), non-conformed dimensionalities in business models (leading to nQSError: 14025 and his buddies) and all the other beautiful and powerful options that the RPD gives you are still amongst the least understood subjects.

These are basics which must be understood. Comprehension is mandatory! Not just slavish adherence to “best practice guides” or “replicating what the guy before you did”.

Uncategorized

I often get to hear the following question concerning OBIEE agents:

“Why can’t we send out personalized content (filtered data / row-level security) to non-OBIEE users by simply using their email address residing in the data?”

Killer answer: Security!

Think about it: If you use “Get Recipients from the Analysis used in the Agent Condition”, it will actually perform a complete login with authentication + authorization through the security realm and only the fetch the data.

Now imagine that you bypass this “because it’s so convenient to just have the email in the data”. And now imagine me doing this:

update MYTABLE set EMAIL = ‘uber.h4xx0r@somenastyplace.thief’;
commit;

I think this should be answer enough as to why you do NOT want to be able to do this.
At all.

Uncategorized

When upgrading existing customized installations of OBIEE to 11.1.1.7, one thing that you may run into is a subtle change in the usage of the vanilla style and skin of the application.

FusionFX has become the default, but isn’t immediately or better directly suited as a basis for your own custom style and skin.
The reason for that is, that FusionFX itself is only a subset of a full style+skin package and the vanilla application continues to use a lot of blafp.

Oh yes, /web/app/res also has become /web/appv2/res for some reason or another within Oracle_BI1, so here’s what you find in there:

A cursory glance at the folder contents of FusionFX and blafp side-by-side shows quite some differences already:

Whipping out out trusty Firebug and what an out-of-the-box applications actually renders, we see blafp used for the application header:

while we see FusionFX being the source for the dashboards themselves:

As most GUI customizations replace first and foremost the logos in the application header and then moving on to the look & feel of the dashboards and analyses, this logically means that adapting the default FusionFX will only get you halfway to your destination.

What you need to do, in order to have a full and complete basis for your own custom skin, which contains all files and artifacts while retaining the slick FusionFX look (it does look a lot leaner and nicer now), is to merge the two into one package. doing this couldn’t be any simpler than this:
1.) clone s_blafp and sk_blafp
2.) copy all the content of s_FusionFX and sk_FusionFX into the respective blafp folders, replacing all existing files

Since FusionFX is a modified subset of blafp, you’ll retain all base blafp files and gain the modified and “newer” FusionFX files which supersede blafp.

All you need to do now, is rename the resulting folders…

…push them to the /analyticsRes/ directory (or whatever directory holds the deployment of your custom style and skin), reference it in the instanceconfig.xml and, voila, you’ve got a complete and fully customizable 11.1.1.7 style and skin package.

Uncategorized

Just a quick note on some security-related things to watch out or during/after an in-place upgrade to OBIEE 11.1.1.7. These were experienced on a 11.1.1.5.3 to 1.1.1.7.0 upgrade on 64bit Linux:

1.) Application Policies:

All custom-created application policies were dropped during the upgrade, leaving only the vanilla ones. Affected file: system-jazn-data.xml.

2.) Application Roles (this one is a bit queerer):

Affected file: system-jazn-data.xml.

Unmodified vanilla roles come through the upgrade unharmed and retain all their vanilla members (users, groups and app roles alike).
Custom roles equally come through the upgrade unharmed and retain all their vanilla as well as custom members of all kinds.

The problem is with vanilla application roles which have received new/additional members when compared to a plain install:
The role itself still exists, but it loses all vanilla members and only retains custom members.

Example application role “BIAdministrator”:

Pre-upgrade members: vanilla group “BIAdministrators” (WLS-native LDAP group); group “CustomAdministrators” (custom LDAP derived group); user “cberg” (custom LDAP derived user) and several others.

Post-upgrade members: group “CustomAdministrators” (custom LDAP derived group); user “cberg” (custom LDAP derived user) – the WLS-native LDAP group has been dropped.

This wasn’t immediately visible due to the new way the members of an application role are displayed (call me old-fashioned, but I prefered the old style – the new doesn’t allocate enough screen real-estate) doesn’t really show it at quick glance and I was wondering why I got weird “Logon Failed” errors when wanting to check the RPD online while all the logs proudly proclaimed “No no, you’re definitely authenticated nicely”. WLS and EM logons oviously work since the app role concept doens’t kick in.

Hope this helps other people from wasting time.

@Borkur seems to have another nice one related to security hanging around. I’ll make sure to ask him to post his one into the comments.

Cheers!

Uncategorized

OBIEE 11.1.1.6.6 (aka 11.1.1.6.0 BP6) is out and until MOS hosts a proper tracking note, here is the list of all patches making up this patch set with direct links.

Patch 15844023    Patch 11.1.1.6.6 (1 of 7) Oracle Business Intelligence Installer
Patch 15844066    Patch 11.1.1.6.6 (2 of 7) Oracle Real Time Decisions
Patch 14800665    Patch 11.1.1.6.6 (3 of 7) Oracle Business Intelligence Publisher
Patch 15843961    Patch 11.1.1.6.6 (4 of 7) Oracle Business Intelligence ADF Components
Patch 15844096    Patch 11.1.1.6.6 (5 of 7) Enterprise Performance Management Components Installed from BI Installer 11.1.1.6.x
Patch 14791926    Patch 11.1.1.6.6 (6 of 7) Oracle Business Intelligence
Patch 15839347    Patch 11.1.1.6.6 (7 of 7) Oracle Business Intelligence Platform Client Installers and MapViewer

As always: don’t forget JDEV patch 13952743

Cheers!

Uncategorized

While I was off, Oracle released OBIEE 11.1.1.6.5 which is another bugfixing patch set which doesn’t bring in new functionality but irons out quite a few quirks.

Here you can find the main MOS article detailling the patches making up this patch set as all bugs fixed in it.

By the way…make sure you don’t forget JDEV patch 13952743.

Cheers!

Uncategorized

Patch 11.1.1.6.4 is here and can be downloaded from MOS.

Once more it’s a 7-pack patch and here are the patch numbers and direct links:

Patch 14538078: PATCH 11.1.1.6.4 (1 OF 7) ORACLE BUSINESS INTELLIGENCE INSTALLER
Patch 14538128: PATCH 11.1.1.6.4 (2 OF 7) ORACLE REAL TIME DECISIONS
Patch 14285344: Patch 11.1.1.6.4 (3 of 7) Oracle Business Intelligence Publisher
Patch 14538164: PATCH 11.1.1.6.4 ( 4 OF 7) ORACLE BUSINESS INTELLIGENCE ADF COMPONENTS
Patch 14415773: Patch 11.1.1.6.4 (5 of 7) Enterprise Performance Management Components Installed from BI Installer 11.1.1.6.x
Patch 14405222: Patch 11.1.1.6.4 (6 of 7) Oracle Business Intelligence
Patch 14409674: Patch 11.1.1.6.4 (7 of 7) Oracle Business Intelligence Platform Client Installers and MapViewer

Documentation’s here: https://updates.oracle.com/Orion/Services/download?type=readme&aru=15499675

Cheers!

Uncategorized

With the
release of the 11.1.1.6.2 BP1 SampleApp V207, I’ve taken a moment to dissect
the usage of the D3.js calendar contained within since it is one of the
examples frequently pointed out to showcase new visualisation capabilities.
Let’s dive a bit deeper into this to understand the way the D3 calendar works and what is necessary to embed this
in any other OBIEE installation.
As-Is in
SampleApp:
Checking
the Answers Criteria block, the analysis is quite straight-forward. “Color Low”
and “Color High” being simply presentation variables grabbing the values passed
from the “Red / Green Color Limit” prompts on the dashboard page.
The actual
functionality of the D3 calendar is contained and controlled by the two narrative
views of the analysis which I will be calling the “Context Narrative” and “Content
Narrative” respectively for the purpose of this post:

Context
narrative:


Key here are
the four JavaScript variables which will be used by the code within the content
narrative below. These are filled by the values collected from the 1st
line of the analysis data set (Rows to display = 1). Generally, when analysing
the D3.js examples, it is hugely helpful to add a simple table view to the
analysis in order to see what the data stream actually brings along from the OBI
server since most examples use mixtures of column references and variables.

VERY
IMPORTANT: year_range2 must always be the end year +1!
You don’t
have to provide these values through dashboard prompts and simply read the from
the data set, but having a means to restrict the data displayed is always comfortable.

Content
narrative:

Prefix:

<script type=”text/javascript” src=”/analyticsRes/d3/d3.v2.js”></script>
    <link type=”text/css” rel=”stylesheet” href=”/analyticsRes/d3/lib/colorbrewer/colorbrewer.css”/>
    <link type=”text/css” rel=”stylesheet” href=”/analyticsRes/d3/examples/calendar/calendar.css”/>

    <div id=”my_chart”></div>
    <script type=”text/javascript”>
var margin = {top: 19, right: 20, bottom: 20, left: 19},
    width = @{Width}{720}- margin.right – margin.left, // width
    height = @{Height}{136} – margin.top – margin.bottom, // height
    cellSize = @{CellSize}{12}; // cell size

var day = d3.time.format(“%w”),
    week = d3.time.format(“%U”),
    percent = d3.format(“.1%”),
    format = d3.time.format(“%Y-%m-%d”);

var color = d3.scale.quantize()
    .domain([cl1,cl2])
    .range(d3.range(9));

var svg = d3.select(“#my_chart”).selectAll(“svg”)
    .data(d3.range(year_range1, year_range2))
  .enter().append(“svg”)
    .attr(“width”, width + margin.right + margin.left)
    .attr(“height”, height + margin.top + margin.bottom)
    .attr(“class”, “RdYlGn”)
  .append(“g”)
    .attr(“transform”, “translate(” + (margin.left + (width – cellSize * 53) / 2) + “,” + (margin.top + (height – cellSize * 7) / 2) + “)”);
svg.append(“text”)
    .attr(“transform”, “translate(-6,” + cellSize * 3.5 + “)rotate(-90)”)
    .attr(“text-anchor”, “middle”)
    .text(String);
var rect = svg.selectAll(“rect.day”)
    .data(function(d) { return d3.time.days(new Date(d, 0, 1), new Date(d + 1, 0, 1)); })
  .enter().append(“rect”)
    .attr(“class”, “day”)
    .attr(“width”, cellSize)
    .attr(“height”, cellSize)
    .attr(“x”, function(d) { return week(d) * cellSize; })
    .attr(“y”, function(d) { return day(d) * cellSize; })
    .datum(format);
rect.append(“title”)
    .text(function(d) { return d; });
svg.selectAll(“path.month”)
    .data(function(d) { return d3.time.months(new Date(d, 0, 1), new Date(d + 1, 0, 1)); })
  .enter().append(“path”)
    .attr(“class”, “month”)
    .attr(“d”, monthPath);

    var csv =[];


What happens
here that I can influence?
This
controls the size of the rendered calendar. Parameters are passed from the dashboard
prompt via presentation variables. If you don’t want users to be able to choose
this, simply put static values.
 
Date format
is controlled here. VERY IMPORTANT: you must match the date format in this part
of the script to the date format provided within the data set:
means “format
= d3.time.format(“%Y-%m-%d”);”
If your
date picture is for example DD.MM.YYYY (e.g. 14.08.2012), then you need to
adjust the script to:
format = d3.time.format(“%d.%m.%Y “);

Specifies
the colour limits (.domain) as retrieved by the dashboard prompts.

Controls
the display of the year number in front of the rectangles representing the
year:
Leave the
rest as-is.
Narrative:
csv.push({“Date”:”@1″,”Metric”:”@2″});
Simply
retrieves the values for date and measure from the data set (per row!). Leave
this as-is.
Postfix:
  var data = d3.nest()
    .key(function(d) { return d.Date; })
    .rollup(function(d) { return d[0].Metric/100; })
    .map(csv);

  rect.filter(function(d) { return d in data; })
      .attr(“class”, function(d) { return “day q” + color(data[d]) + “-9”; })
    .select(“title”)
      .text(function(d) { return d + “: ” + percent(data[d]); });

function monthPath(t0) {
  var t1 = new Date(t0.getFullYear(), t0.getMonth() + 1, 0),
      d0 = +day(t0), w0 = +week(t0),
      d1 = +day(t1), w1 = +week(t1);
  return “M” + (w0 + 1) * cellSize + “,” + d0 * cellSize
      + “H” + w0 * cellSize + “V” + 7 * cellSize
      + “H” + w1 * cellSize + “V” + (d1 + 1) * cellSize
      + “H” + (w1 + 1) * cellSize + “V” + 0
      + “H” + (w0 + 1) * cellSize + “Z”;
}
</script>

What happens
here that I can influence?
For the SampleApp
example, this transforms the values retrieved from the data set into an index representation
for transformation into a percentile representation in the tooltip display.
If you want absolute
values, simply change
“.rollup(function(d) {
return d[0].Metric/100; })”
to
“.rollup(function(d) {
return d[0].Metric; })”

This colours the date
rectangles and the actual tooltip with date information and the added percentile
representation of the measure. Here, if you want absolute values, simply change
“.text(function(d) {
return d + “: ” + percent(data[d]); });”
to
“.text(function(d) {
return d + “: ” + data[d] });”
Leave the rest as-is.
So what do you need
all-in-all to transplant this into any OBIEE implementation?

1.) The
D3 libraries contained in the d3 and d3-cloud folders. Quickest way – if you
have the SampleApp lying around – is to just grab them from the analyticsRes
folder of the VirtualBox and slap them into your own analyticsRes

2.) An
analysis on the date (day!) grain with some measure. Since you can either
hard-code the time ranges, size and colour limits, those two are really the
bare minimum for this D3 calendar to work.
That’s it. Bob’s your
uncle.

UPDATE: Since the D3.js libraries are only dependent of the final browser interpreting the generated code (IE8 will NOT work!), you can transplant this into any version of OBIEE that you fancy. This functionality is NOT tied to OBIEE 11.1.1.6.