The next release of Oracle Analytics Cloud will be 5.9. For a change I thought it would be interesting to look at the upcoming new features from a solution point of view rather than a product point of view. I.e. not just “what’s in the product” but rather “what do you use it for and how does it actually help you”. Also this allows you to have a sneak peak before the actual GA release.
Please note that this list isn’t a 100% coverage of all new features and changes. The official documentation of new features can be found here. I will also link another blog post below which covers other aspects of the 5.9 release.
System features and settings
Snapshots
Strange to start a solution overview from a system perspective? It may seem so at first glance. However it is worth to remember that “new animated visuals” never made a project successful. New ways of supporting the workflow and daily embedding of analytic into your business processes? Definitely so.
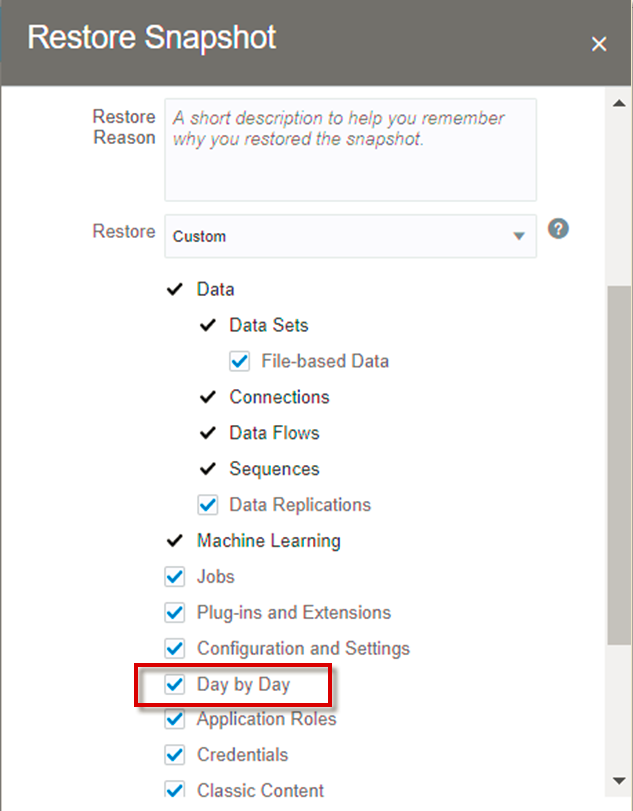
The main new feature for advanced users on this front is definitely the extended snapshot options. They now include the ability to snapshot “Day by Day” content. Shared cards, Bring backs and your own “For you” feeds. Never miss your Day by Day content again when backing up an environment or moving content from one instance to the other!
Export settings
While we do all in our power to help users to do their work INSIDE the system, we can never fully stop data from exiting the system. Unsurprisingly this area receives continuous enhancements. First of all, the limits for raw data or formatted data export have been increased across the board for all instance shapes.
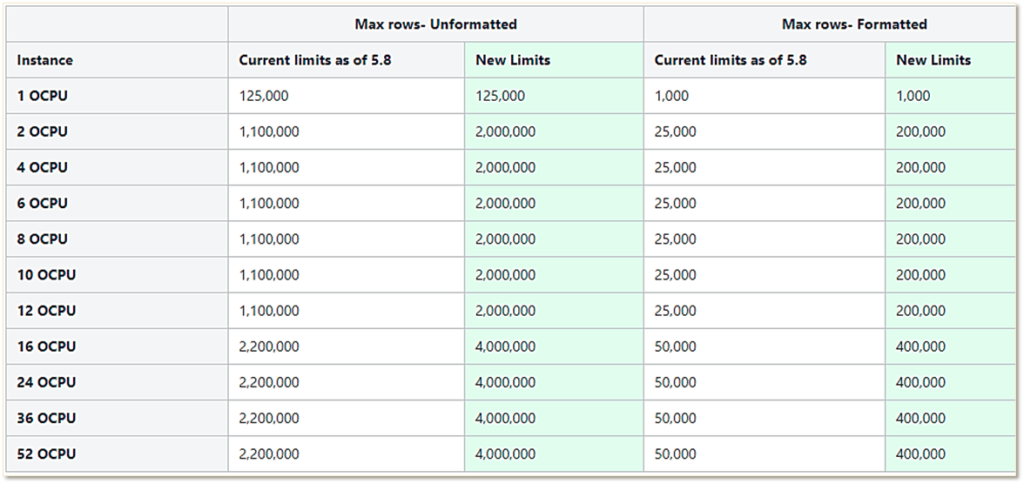
By the way since this is a question I keep getting asked, you can always find the current values for all shapes in the official documentation.
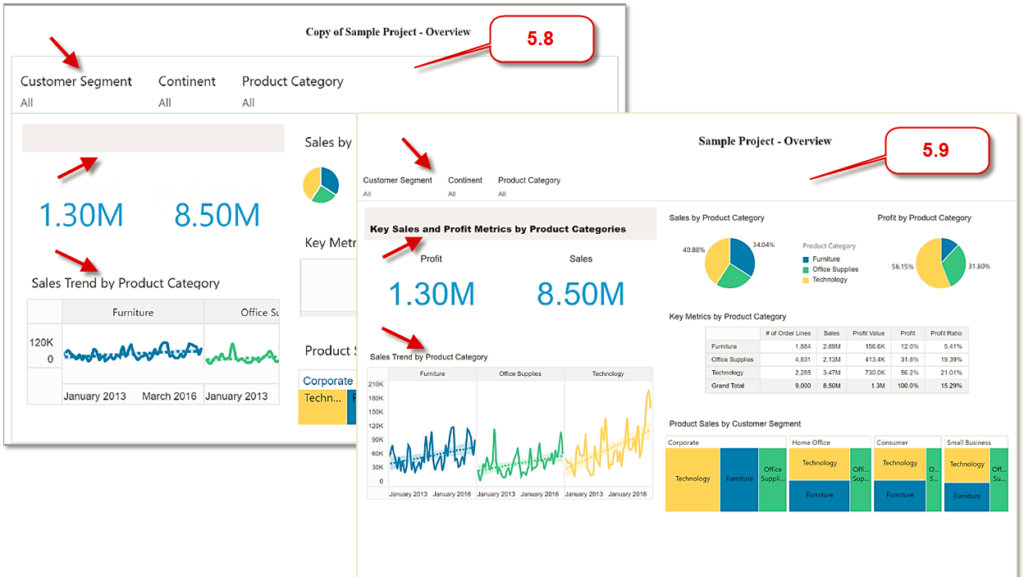
Another enhancement for exports has been done in the area of purely visual/graphical exports like PDF. All content is now exported in a pure WYSIWYG fashion:
Enhancements for Data Prep / Data Engineering
Two new functions were added to the data prep part of the solution. Very typical and common functions which users tended to shoehorn into SQL statements in order to work around bad data.
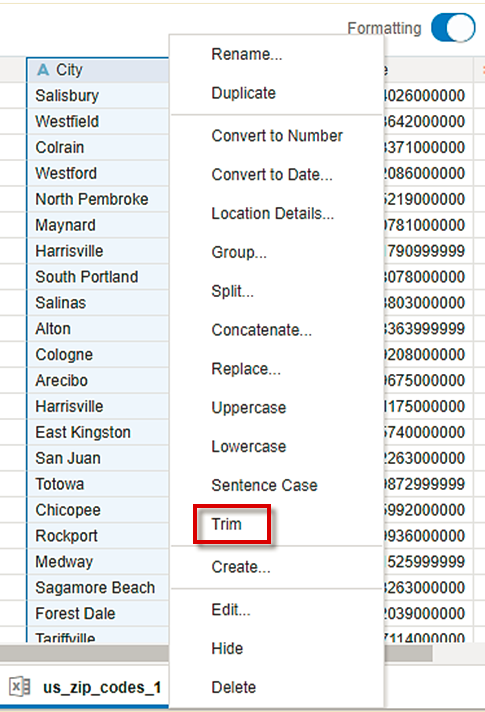
a) Trim
How often do source systems or external data providers contain superfluous blank spaces? This is handled now and available at the click of a button. No more code:
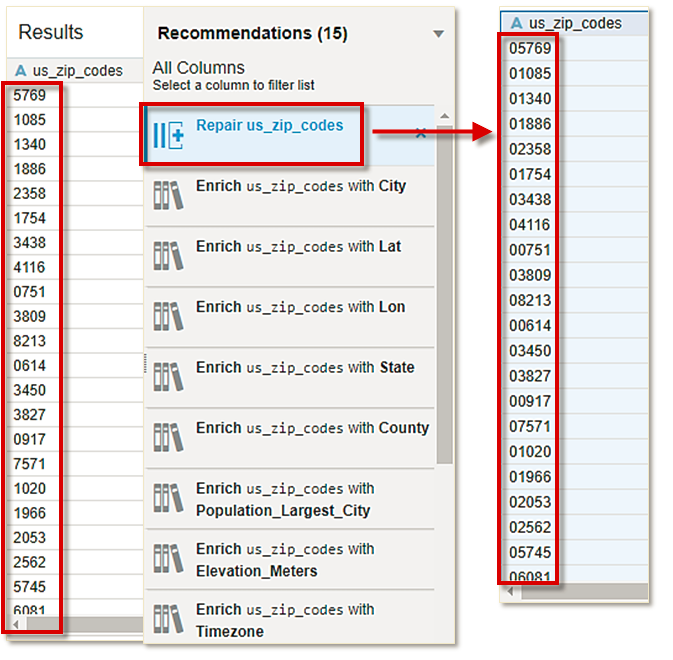
b) Leading zeroes
Is 012345 a number? Kind of, but only because your brain reads it as that. Technically it’s a string. Argue all you want but that’s what it is. Still want to give business the ability to use leading zeroes in data sets? Again that’s at your disposal now with but a click.
UX Enhancements
Densification
Screen real-estate is crucial for a simple reason. Wasting usable space hinders productivity. And the idea that all users constantly work on 32”, 4k screens is not reflecting reality.
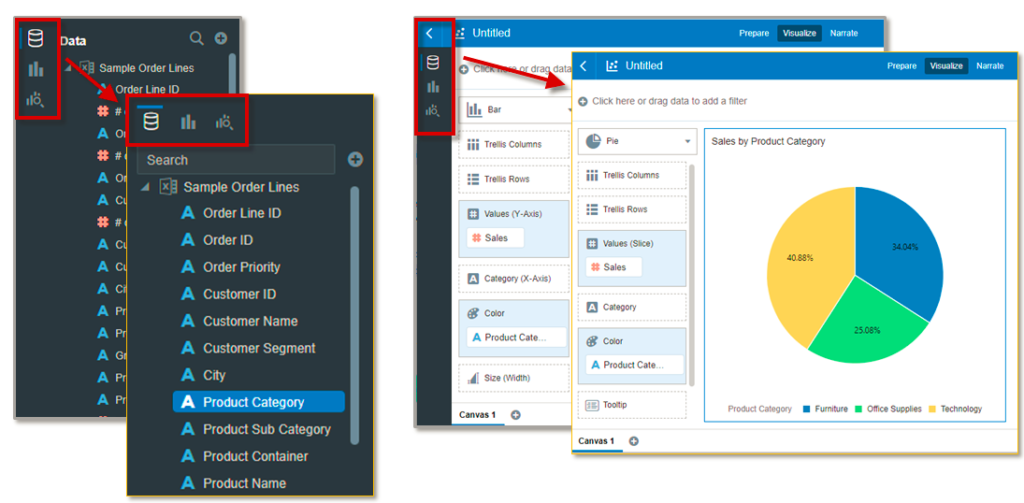
Progress bars were moved, the side bar in Data Visualization (DV) was changed to a top bar and a permanent search box was added. That last bit is a definite life saver for analysts asking with data sets that comprise dozens if not hundreds of attributes
Sorting and Filtering
Pretty much the two things which users do the most: filter data and sort data. You can’t have enough functionalities there since otherwise you inevitably drive them back into their destructive relationship with Excel.
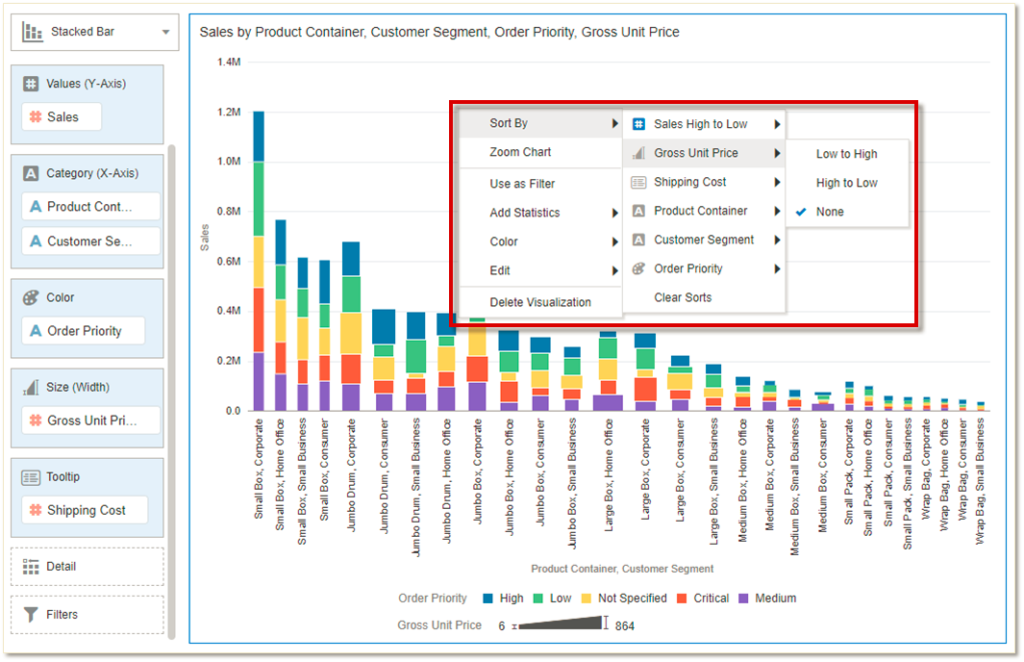
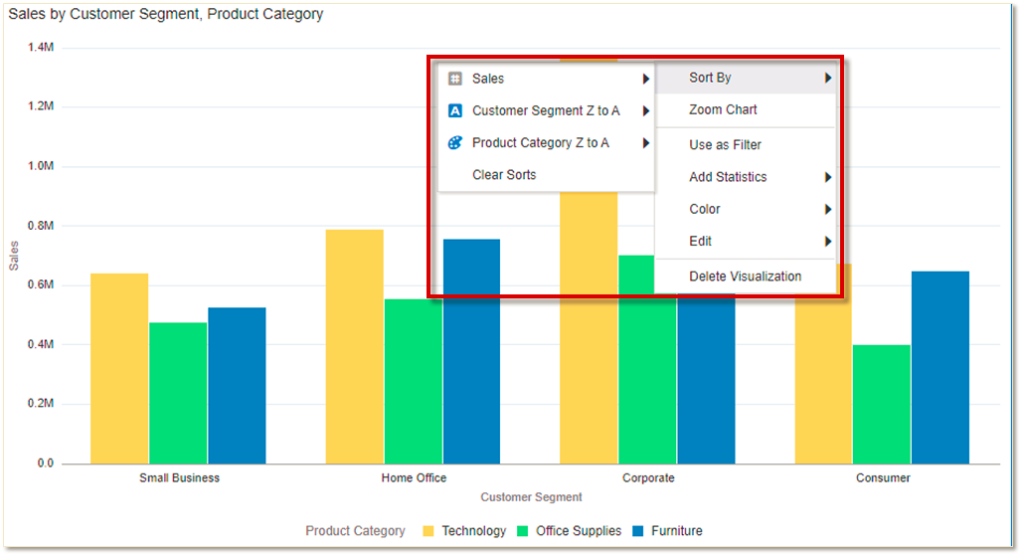
The context menu has been enhanced to allow for a definition of sort orders for each attribute or measure used in a visualization. Furthermore to this ability for multi-layer sorting of attributes, “sort x by y” for measures has been added:
Filters have received an overhaul and more detailed control options. Each visualization can now be controlled in detail with regards to using the viz filter bar, “use as filter” and “Show Filter Toggle”:
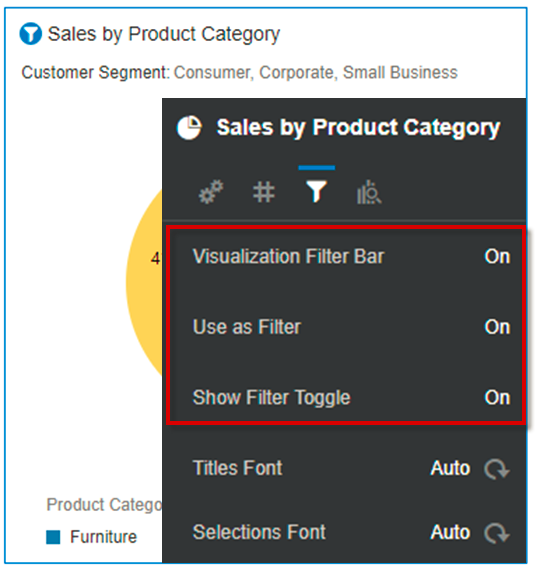
Especially “Show Filter Toggle” is a neat feature as it allows you to disable the end user to himself decide whether to use filters on a viz. Comes in very handy when your viz is built for an extremely specific point of view. Less possibility of confusion and invalid interpretation of displayed information!
Charting
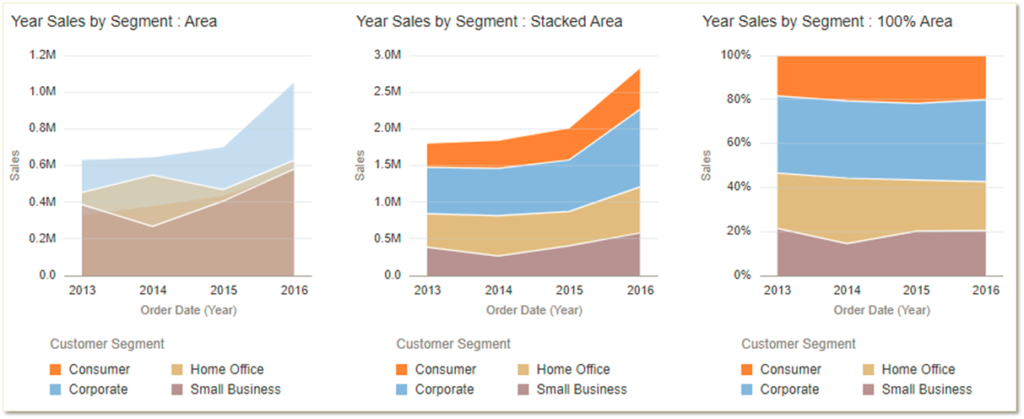
5.9 enhances the charting engine for area charts. You now have the choice between standard area charts, stacked area charts and 100% stacked area charts.
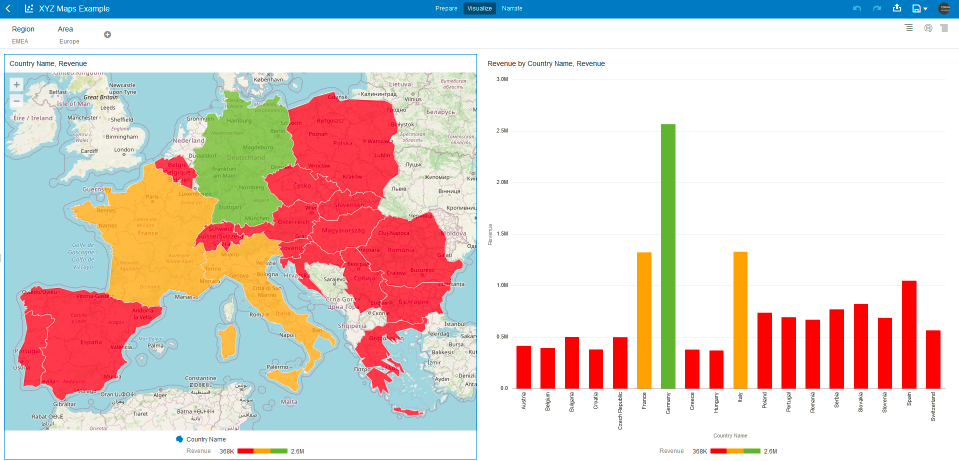
WMS/XYZ Maps Support
Lastly there is now extended support for using externally-hosted background maps. The support for two new formats now makes the easy use of ESRI or ArcGIS a thing of a couple of clicks: Web Map Services and XYZ tiled maps respectively.
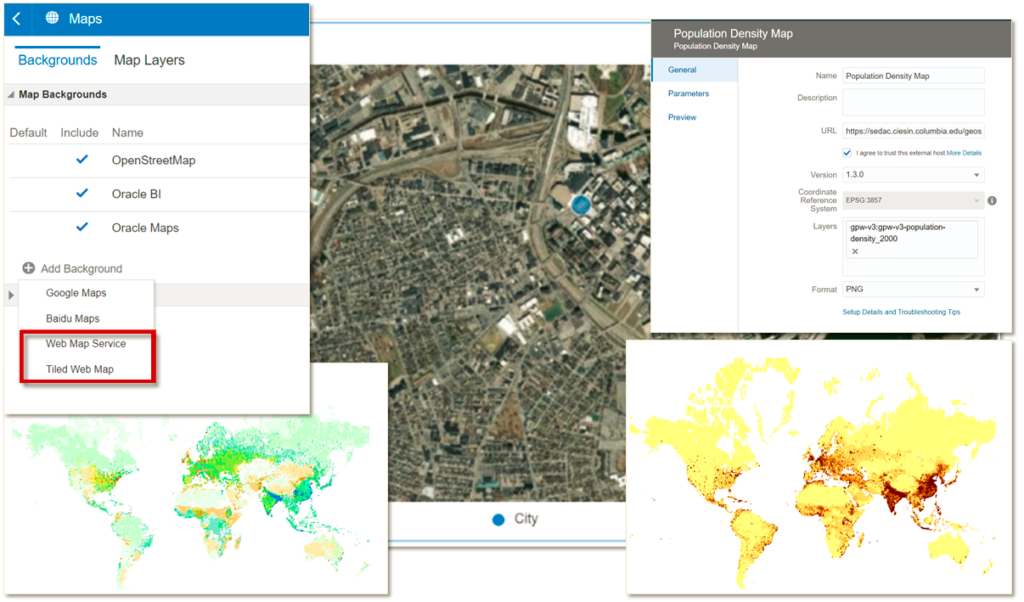
Map usage is still something that analysts crave but at the same time struggle with. It isn’t a trivial topic due to its inherent complexity and every additional bit of supporting functionality helps enable more users to leverage this powerful capability.
This concludes my overview of OAC 5.9 new features and their usage. If you want to read more on the embedded options of Oracle machine Learning and database analytics, please continue reading on Gianni Ceresa’s excellent blog post.