Ok, be honest here for a moment guys: who of you was aware that you can sort on multiple columns in a table view rendered in a dashboard?
Kudos to Erick!
Cheers,
C.
Ok, be honest here for a moment guys: who of you was aware that you can sort on multiple columns in a table view rendered in a dashboard?
Kudos to Erick!
Cheers,
C.
Fiddling around with some more functional options we’ve all come to know, like and use frequently, I found that “in between” filters in answers requests going against MDX sources (Essbase, MS Analysis server etc) don’t work as expected.
To showcase this, I have created a simple request. Planning and Current numbers by Fiscal Month within Europe. And I’m interested in all months between Q1 2009 and Q4 2009:
 |
Checking the results tab we see that it’s not necessarily what we’d expect:
 |
Doing a full data scroll reveals that basically all Fiscal Month members are being pulled up.
Here’s the MDX from the log:
With
set [Geo3] as ‘Filter([Geo].Generations(3).members, (([Geo].CurrentMember.MEMBER_ALIAS = “Europe” OR [Geo].CurrentMember.MEMBER_Name = “Europe”)))’
set [Time Period3] as ‘Filter([Time Period].Generations(3).members, ( NOT (([Time Period].CurrentMember.MEMBER_ALIAS < "Q1-09" OR [Time Period].CurrentMember.MEMBER_Name < "Q1-09"))) AND ( NOT (("Q4-09" < [Time Period].CurrentMember.MEMBER_ALIAS OR "Q4-09" < [Time Period].CurrentMember.MEMBER_Name))))'
set [Time Period4] as ‘Generate({[Time Period3]}, Descendants([Time Period].currentmember, [Time Period].Generations(4),SELF), ALL)’
member [Scenario].[MS1] as ‘AGGREGATE(crossjoin {[Geo3]},Scenario.[Current])’, SOLVE_ORDER = 100
member [Scenario].[MS2] as ‘AGGREGATE(crossjoin {[Geo3]},Scenario.[Planned])’, SOLVE_ORDER = 100
select
{ [Scenario].[MS1],
[Scenario].[MS2],
[Scenario].[MS3]
} on columns,
NON EMPTY {{[Time Period4]}} properties ANCESTOR_NAMES, GEN_NUMBER on rows
from [Sample.Sample]
And here’s the important bit:
set [Time Period3] as ‘Filter([Time Period].Generations(3).members, ( NOT (([Time Period].CurrentMember.MEMBER_ALIAS < "Q1-09" OR [Time Period].CurrentMember.MEMBER_Name < "Q1-09"))) AND ( NOT (("Q4-09" < [Time Period].CurrentMember.MEMBER_ALIAS OR "Q4-09" < [Time Period].CurrentMember.MEMBER_Name))))'
I’ve opened an SR for this since there’s no mentioning on metalink, the release notes or the new features guides.
Cheers,
Christi@n
Recently I was off to change the print options on all of my dashboard pages. Naturally, as with all setting, this is encoded in the XML and can be mass-manipulated by the catalog manager.
Here’s the section in the XML, changed for landscape format, A4 paper size (yes, no weird US sizes ;-)) and explicit exclusion of headers and footers:
< ?xml version="1.0" encoding="UTF-8"?>
< sawd:dashboardpage sawd="com.siebel.analytics.web/dashboard/v1" saw="com.siebel.analytics.web/report/v1" xmlversion="200705140" isempty="false" duid="hsdfj3478387bs82" personalselections="true">
.
.
.
< span style="font-weight:bold;">
< saw:pageheader show="false">
< saw:pagefooter show="false">
< /saw:pagefooter>
< /saw:pageheader>
Cheers,
Christi@n
Leave it to Doctor Venkat to sum this one up so nicely:
Greetings, programs!
Something I ran into recently is a little bug in the way OBIEE 10.1.3.4.0 produces MDX out of an EVALUATE wrapper when the MDX contains special characters. (yes, it is a bug)
Let’s start with a basic and pure OBIEE report. We want to see the average coverage % by the 3rd generation of our product hierarchy:


Now let’s switch out the presentation column for an EVALUATE function with MDX as what we really want is the average coverage % for the scenario “Actual”:

EVALUATE(‘(%1.dimension.currentmember, [Scenario].[Actual],[Account].[Coverage % Avg]).value’ as INTEGER, Product.”Gen3,Product”)
Let’s run it.

“Unknown Member Coverage % Avg”? Liar. I see it directly in front of me. Off to checking the log:
With
set [Product3] as ‘Generate([Product].Generations(2).members, Descendants([Product].currentmember, [Product].Generations(3), leaves))’
member [Account].[MS1] as ‘([Product].Generations(3).dimension.currentmember,[Scenario].[Actual],[Account].[Coverage % Avg])).value’
member [Account].[MS2] as ‘RANK([Product].Generations(3).dimension.currentmember,[Product].Generations(3).members)’
select
{MS1,
MS2} on columns,
{{[Product3]}} properties ANCESTOR_NAMES, GEN_NUMBER on rows
from [MyCube.Ess931_ASO]
——————– Query Status: Query Failed: Essbase Error: Unknown Member Coverage % Avg used in query
Do you see the difference? While on the guy, it states “Coverage % Avg”, the log and the MDX which is actually fired, reference “Coverage % Avg”. TWO spaces!
So let’s work around this by changing the EVALUATE to include the “StrToMbr” function:

EVALUATE(‘(%1.dimension.currentmember, [Scenario].[Actual],StrToMbr(“[Account].[Coverage % Avg]”)).value’ as INTEGER, Product.”Gen3,Product”)
When running this, we get the correct results again:

So if you want to reference members containing special characters, use StrToMbr since otherwise you will get a non-functioning MDX from the BI server.
End of line.
Greetings, programs!
Following up on my Essbase ranking post and a question from OTN, I’d like to elaborate on the ranking and filtering of the rank results.
Again, we start with a basic report showing the top10 products by actual sales. We’re not using OBIEE functions due to the performance constraints mentioned in the first article.

The core MDX function retrieving the dimension members being:
EVALUATE(‘TOPCOUNT(%1.members,10,[Actual])’,Product.”Gen6,Product”)

Business now wants to implement filters on Gen2 through Gen5 of the product hierarchy in order to be able to more specifically choose their top10 products. This normally means four “is prompted” filters and a dashboard prompt containing Gen2 through 5 as hierarchically constrained prompt column. Let’s keep it simple and try one of the generations as a fixed filter before creating the prompts and testing in a dashboard context.


As already stated, the grain of the query changes to the one of the filter and renders the whole request useless.
MDX without filter:
With
set [Account3] as ‘Filter([Account].Generations(3).members, (([Account].CurrentMember.MEMBER_ALIAS = “Net Sales” OR [Account].CurrentMember.MEMBER_Name = “Net Sales”)))’
set [Market3] as ‘Filter([Market].Generations(3).members, (([Market].CurrentMember.MEMBER_ALIAS = “Europe” OR [Market].CurrentMember.MEMBER_Name = “Europe”)))’
set [Time Period3] as ‘Filter([Time Period].Generations(3).members, (([Time Period].CurrentMember.MEMBER_ALIAS = “Q4-09” OR [Time Period].CurrentMember.MEMBER_Name = “Q4-09”)))’
set [Evaluate0] as ‘{TOPCOUNT([Product].Generations(6).members,10,[Actual]) }’
member [Scenario].[MS1] as ‘AGGREGATE(crossjoin ({[Account3]},crossjoin ({[Market3]},{[Time Period3]})),Scenario.[Actual LY])’, SOLVE_ORDER = 100
member [Scenario].[MS2] as ‘AGGREGATE(crossjoin ({[Account3]},crossjoin ({[Market3]},{[Time Period3]})),Scenario.[Actual])’, SOLVE_ORDER = 100
select
{ [Scenario].[MS1],
[Scenario].[MS2]
} on columns,
NON EMPTY {{[Evaluate0]}} properties ANCESTOR_NAMES, GEN_NUMBER on rows
from [MyCube_A.MyCube]
MDX with filter:
With
set [Account3] as ‘Filter([Account].Generations(3).members, (([Account].CurrentMember.MEMBER_ALIAS = “Net Sales” OR [Account].CurrentMember.MEMBER_Name = “Net Sales”)))’
set [Market3] as ‘Filter([Market].Generations(3).members, (([Market].CurrentMember.MEMBER_ALIAS = “Europe” OR [Market].CurrentMember.MEMBER_Name = “Europe”)))’
set [Product4] as ‘Filter([Product].Generations(4).members, (([Product].CurrentMember.MEMBER_ALIAS = “SMU PF – Business Products” OR [Product].CurrentMember.MEMBER_Name = “SMU PF – Business Products”)))’
set [Time Period3] as ‘Filter([Time Period].Generations(3).members, (([Time Period].CurrentMember.MEMBER_ALIAS = “Q4-09” OR [Time Period].CurrentMember.MEMBER_Name = “Q4-09”)))’
set [Evaluate0] as ‘{TOPCOUNT([Product].Generations(6).members,10,[Actual]) }’
member [Scenario].[MS1] as ‘AGGREGATE(crossjoin ({[Account3]},crossjoin ({[Market3]},crossjoin ({[Product4]},{[Time Period3]}))),Scenario.[Actual LY])’, SOLVE_ORDER = 100
member [Scenario].[MS2] as ‘AGGREGATE(crossjoin ({[Account3]},crossjoin ({[Market3]},crossjoin ({[Product4]},{[Time Period3]}))),Scenario.[Actual])’, SOLVE_ORDER = 100
select
{ [Scenario].[MS1],
[Scenario].[MS2]
} on columns,
NON EMPTY {{[Evaluate0]}} properties ANCESTOR_NAMES, GEN_NUMBER on rows
from [MyCube_A.MyCube]
Lets’ forget about OBIEE filtering. This means that we have to do the filtering within the MDX and make that filter respond to the prompts. For this we will use presentation variables and a new MDX statement:

EVALUATE(‘TOPCOUNT(Intersect(%1.dimension.members,Descendants([@{vPromptedProdHier}{SMU}],[Product].[Gen6,Product])),10,[Actual])’,Product.”Gen6,Product”)
And here’s the prompt to go with it:

The multiple usage of the same presentation variable ensures that we will always have the lowest level currently chosen populated in the hierarchy, which will nicely adapt our MDX statement to constrain the results to the descendants of the chosen dimension member.
Family:

With
set [Account3] as ‘Filter([Account].Generations(3).members, (([Account].CurrentMember.MEMBER_ALIAS = “Net Sales” OR [Account].CurrentMember.MEMBER_Name = “Net Sales”)))’
set [Market3] as ‘Filter([Market].Generations(3).members, (([Market].CurrentMember.MEMBER_ALIAS = “Europe” OR [Market].CurrentMember.MEMBER_Name = “Europe”)))’
set [Time Period3] as ‘Filter([Time Period].Generations(3).members, (([Time Period].CurrentMember.MEMBER_ALIAS = “Q4-09” OR [Time Period].CurrentMember.MEMBER_Name = “Q4-09”)))’
set [Evaluate0] as ‘{TOPCOUNT(Intersect([Product].Generations(6).dimension.members,Descendants([SMU PF – Business Products],[Product].[Gen6,Product])),10,[Actual]) }’
member [Scenario].[MS1] as ‘AGGREGATE(crossjoin ({[Account3]},crossjoin ({[Market3]},{[Time Period3]})),Scenario.[Actual LY])’, SOLVE_ORDER = 100
member [Scenario].[MS2] as ‘AGGREGATE(crossjoin ({[Account3]},crossjoin ({[Market3]},{[Time Period3]})),Scenario.[Actual])’, SOLVE_ORDER = 100
select
{ [Scenario].[MS1],
[Scenario].[MS2]
} on columns,
NON EMPTY {{[Evaluate0]}} properties ANCESTOR_NAMES, GEN_NUMBER on rows
from [MyCube_A.MyCube]
Group:

With
set [Account3] as ‘Filter([Account].Generations(3).members, (([Account].CurrentMember.MEMBER_ALIAS = “Net Sales” OR [Account].CurrentMember.MEMBER_Name = “Net Sales”)))’
set [Market3] as ‘Filter([Market].Generations(3).members, (([Market].CurrentMember.MEMBER_ALIAS = “Europe” OR [Market].CurrentMember.MEMBER_Name = “Europe”)))’
set [Time Period3] as ‘Filter([Time Period].Generations(3).members, (([Time Period].CurrentMember.MEMBER_ALIAS = “Q4-09” OR [Time Period].CurrentMember.MEMBER_Name = “Q4-09”)))’
set [Evaluate0] as ‘{TOPCOUNT(Intersect([Product].Generations(6).dimension.members,Descendants([SMU PG – BP Video],[Product].[Gen6,Product])),10,[Actual]) }’
member [Scenario].[MS1] as ‘AGGREGATE(crossjoin ({[Account3]},crossjoin ({[Market3]},{[Time Period3]})),Scenario.[Actual LY])’, SOLVE_ORDER = 100
member [Scenario].[MS2] as ‘AGGREGATE(crossjoin ({[Account3]},crossjoin ({[Market3]},{[Time Period3]})),Scenario.[Actual])’, SOLVE_ORDER = 100
select
{ [Scenario].[MS1],
[Scenario].[MS2]
} on columns,
NON EMPTY {{[Evaluate0]}} properties ANCESTOR_NAMES, GEN_NUMBER on rows
from [MyCube_A.MyCube]
End of line.
Greetings, programs!
Something that came up on OTN:
Cast a metric (number) as char but still have the thousand separator. E.g.: if “Sales” > 1000 then “Nothing to report” else 1’000?
Here’s a formula you can use:
case when (LENGTH(cast(Fact.Sales as char)) > 12) then
(SUBSTRING(cast(Fact.Sales as char) FROM LENGTH(cast(Fact.Sales as char)) – 15 FOR 3) || ””)
else ” END ||
case when (LENGTH(cast(Fact.Sales as char)) > 9) then
SUBSTRING(cast(Fact.Sales as char) FROM LENGTH(cast(Fact.Sales as char)) – 12 FOR 3) || ””
else ” END ||
case when (LENGTH(cast(Fact.Sales as char)) > 6) then
SUBSTRING(cast(Fact.Sales as char) FROM LENGTH(cast(Fact.Sales as char)) – 9 FOR 3) || ””
else ” END ||
case when (LENGTH(cast(Fact.Sales as char)) > 0) then
SUBSTRING(cast(Fact.Sales as char) FROM LENGTH(cast(Fact.Sales as char)) – 6 FOR 7)
else ‘Nothing to report’ END
End of line.
Little reminder for myself. GoURL doesn’t like essbase generation names:
saw.dll?Go&Path=/users/administrator/SMU&Options=rd&Action=Navigate&P0=1&P1=eq&P2=Product.”Gen2,Marketing Product”&P3=SMU’
Gotta URL encode it…
saw.dll?Go&Path=/users/administrator/SMU&Options=rd&Action=Navigate&P0=1&P1=eq&P2=Product.%22Gen2,Marketing Product%22&P3=SMU’
Update:
Unfortunately I can forget that Idea since I can’t wrap the GoURL around an EVALUATE function. Keep you posted…
Greetings, programs!
So I was doing some ranking reports on Essbase sources. From a rather simple request, this developed into a long quest for the best solution in terms of performance, usability, flexibility and making the thing dynamic. For anyone who faces this…here’s a quick overview of the steps I went through and my findings. You might need to scroll somewhat to get to the final solution.
The report was basically about getting the top N products by “actual versus forecast” “gross sales and backlog” (i.e. two measure hierarchies are taking part in this) on the lowest level of the product dimension with N being a prompted value.
The product dimension itself included two hierarchies: business and marketing. The split beginning at Generation2, the query should only look at the marketing hierarchy and then filter more detailed on the marketing units (Gen3) in a prompt.
Fair enough. So let’s create this using the normal functionalities in Answers.
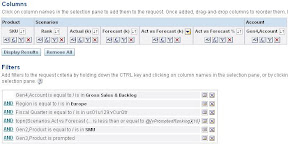 |
The important bit being the “Rank” column:
topn(Scenarios.”Act vs Forecast”,@{vPromptedRanking}{10})
Firing this off against the datasource results in…a long while of me staring at “Retrieving data”. Performance is quite bad with this simple example taking 35 seconds. In my other use cases with more members and especially some nasty calculated members in the account hierarchy we are hitting up to 5 minutes in the dashboard with all the prompts and whatnot. Unacceptable. To the log(cave)!
+++Administrator:2e0000:2e0039:—-2009/03/27 03:24:27
——————– Sending query to database named MyCube Scenarios (id: ):
With
set [Account4] as ‘Filter([Account].Generations(4).members, ([Account].currentmember.MEMBER_ALIAS = “Gross Sales & Backlog” OR [Account].currentmember.MEMBER_Name = “Gross Sales & Backlog”))’
set [Market3] as ‘Filter([Market].Generations(3).members, ([Market].currentmember.MEMBER_ALIAS = “Europe” OR [Market].currentmember.MEMBER_Name = “Europe”))’
set [Product2] as ‘Filter([Product].Generations(2).members, ([Product].currentmember.MEMBER_ALIAS = “SMU” OR [Product].currentmember.MEMBER_Name = “SMU”))’
set [Product8] as ‘Generate({[Product2]}, Descendants([Product].currentmember, [Product].Generations(8),SELF), ALL)’
set [Time Period3] as ‘Filter([Time Period].Generations(3).members, ([Time Period].currentmember.MEMBER_ALIAS = “Q4-09” OR [Time Period].currentmember.MEMBER_Name = “Q4-09”))’
member [Scenario].[MS1] as ‘AGGREGATE(crossjoin ({[Market3]},{[Time Period3]}),Scenario.[Act vs Forecast])’, SOLVE_ORDER = 100
member [Scenario].[MS2] as ‘AGGREGATE(crossjoin ({[Market3]},{[Time Period3]}),Scenario.[Act vs Forecast %])’, SOLVE_ORDER = 100
member [Scenario].[MS3] as ‘AGGREGATE(crossjoin ({[Market3]},{[Time Period3]}),Scenario.[Forecast])’, SOLVE_ORDER = 100
member [Scenario].[MS4] as ‘AGGREGATE(crossjoin ({[Market3]},{[Time Period3]}),Scenario.[Actual])’, SOLVE_ORDER = 100
select
{ [Scenario].[MS1],
[Scenario].[MS2],
[Scenario].[MS3],
[Scenario].[MS4]
} on columns,
NON EMPTY {crossjoin ({[Account4]},{[Product8]})} properties ANCESTOR_NAMES, GEN_NUMBER on rows
from [MyCube_A.MyCube]
+++Administrator:2e0000:2e0039:—-2009/03/27 03:25:02
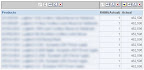
First thing we see: there’s no ranking. No restriction whatsoever with regards to the “Act vs Forecast”. What does this mean for the query? It will actually retrieve me all the members I’ve chosen for all rows in the query. Unconstrained except for the filters in the “With” statement. Not very performing to start with, but that full data stream is then received by the BI server, treated again and everything after number 10 cut off:
+++Administrator:2e0000:2e0039:—-2009/03/27 03:25:02
——————– Rows 1363, bytes 774184 retrieved from database query id:
+++Administrator:2e0000:2e0039:—-2009/03/27 03:25:02
——————– Physical query response time 34 (seconds), id
+++Administrator:2e0000:2e0039:—-2009/03/27 03:25:02
——————– Physical Query Summary Stats: Number of physical queries 1, Cumulative time 34, DB-connect time 0 (seconds)
+++Administrator:2e0000:2e0039:—-2009/03/27 03:25:02
——————– Rows returned to Client 10
+++Administrator:2e0000:2e0039:—-2009/03/27 03:25:02
——————– Logical Query Summary Stats: Elapsed time 35, Response time 34, Compilation time 0 (seconds)
Basically the TopN function isn’t translated into its Essbase cousin TopCount which would have neatly given us 10 records right from the start. To cut the story short for this bit: I’ve gotten a confirmation from Metalink: “1. Yes none of the Answer based functions are translated into MDX functions for 10G. This may be implemented in 11g.” Bugger.
While the SR was pending I already had started with my alternative approach. Do whatever it takes to constrain the data set with the obvious choice being the usage of TopCount. To test faster I shrink the report. The prompts are kicked out and only generic filters kept.
 |
Major change is the usage of an EVALUATE function which retrieves me the dimension members I want:
EVALUATE(‘TOPCOUNT(%1.members,10,[Act vs Forecast])’,Product.”Gen8,Product”)
Let’s look at the query:
+++Administrator:2e0000:2e0043:—-2009/03/27 04:20:07
——————– Sending query to database named MyCube Scenarios (id: ):
With
set [Account4] as ‘Filter([Account].Generations(4).members, ([Account].currentmember.MEMBER_ALIAS = “Gross Sales & Backlog” OR [Account].currentmember.MEMBER_Name = “Gross Sales & Backlog”))’
set [Market3] as ‘Filter([Market].Generations(3).members, ([Market].currentmember.MEMBER_ALIAS = “Europe” OR [Market].currentmember.MEMBER_Name = “Europe”))’
set [Time Period3] as ‘Filter([Time Period].Generations(3).members, ([Time Period].currentmember.MEMBER_ALIAS = “Q4-09” OR [Time Period].currentmember.MEMBER_Name = “Q4-09”))’
set [Evaluate0] as ‘{TOPCOUNT([Product].Generations(8).members,10,[Act vs Forecast]) }’
member [Scenario].[MS1] as ‘AGGREGATE(crossjoin ({[Account4]},crossjoin ({[Market3]},{[Time Period3]})),Scenario.[Actual)’, SOLVE_ORDER = 100
select
{ [Scenario].[MS1]
} on columns,
NON EMPTY {{[Evaluate0]}} properties ANCESTOR_NAMES, GEN_NUMBER on rows
from [MyCube_A.MyCube]
Ok. 10 rows queried from Essbase. Performance is at 10 seconds for the whole report Next step: I bring back the prompts constraining on the marketing branch of the hierarchy and the marketing units in particular:
——————– Sending query to database named MyCube Scenarios (id: ):
With
set [Account4] as ‘Filter([Account].Generations(4).members, ([Account].currentmember.MEMBER_ALIAS = “Net Sales & Backlog” OR [Account].currentmember.MEMBER_Name = “Net Sales & Backlog”))’
set [Market3] as ‘Filter([Market].Generations(3).members, ([Market].currentmember.MEMBER_ALIAS = “Europe” OR [Market].currentmember.MEMBER_Name = “Europe”))’
set [Product2] as ‘Filter([Product].Generations(2).members, ([Product].currentmember.MEMBER_ALIAS = “SMU” OR [Product].currentmember.MEMBER_Name = “SMU”))’
set [Time Period3] as ‘Filter([Time Period].Generations(3).members, ([Time Period].currentmember.MEMBER_ALIAS = “Q4-09” OR [Time Period].currentmember.MEMBER_Name = “Q4-09”))’
set [Evaluate0] as ‘{TOPCOUNT([Product].Generations(6).members,5,[Act vs Forecast]) }’
member [Scenario].[MS1] as ‘AGGREGATE(crossjoin ({[Account4]},crossjoin ({[Market3]},crossjoin ({[Product2]},{[Time Period3]}))),Scenario.[Actual])’, SOLVE_ORDER = 100
select
{ [Scenario].[MS1]
} on columns,
NON EMPTY {{[Evaluate0]}} properties ANCESTOR_NAMES, GEN_NUMBER on rows
from [MyCube_A.MyCube]
 |
Cute. If I combine TopCount with OBIEE filters and both of them are based on the same dimension, the aggregation level is changed to the one of the filter criteria. Since I use SMU, all numbers are retrieved for this level. Lesson learned.
New MDX:
EVALUATE(‘Intersect(TopCount(Descendants([SMU],6,SELF),10,[Act vs Forecast]),%1.dimension.members)’,Product.”Gen8,Product”)
This one’s a bit more complex to read, but we basically force an intersection of the top 10 descendants of the marketing hierarchy starting member called SMU, 6 generations down (since SMU is generation 2) with the lowest level product.
The results are nothing but staggering in terms of performance increase.
+++Administrator:2e0000:2e0040:—-2009/03/27 04:04:14
——————– Sending query to database named MyCube Scenarios (id: ):
With
set [Account4] as ‘Filter([Account].Generations(4).members, ([Account].currentmember.MEMBER_ALIAS = “Gross Sales & Backlog” OR [Account].currentmember.MEMBER_Name = “Gross Sales & Backlog”))’
set [Market3] as ‘Filter([Market].Generations(3).members, ([Market].currentmember.MEMBER_ALIAS = “Europe” OR [Market].currentmember.MEMBER_Name = “Europe”))’
set [Time Period3] as ‘Filter([Time Period].Generations(3).members, ([Time Period].currentmember.MEMBER_ALIAS = “Q4-09” OR [Time Period].currentmember.MEMBER_Name = “Q4-09”))’
set [Evaluate0] as ‘{Intersect(TopCount(Descendants([SMU],4,SELF),10,[Act vs Forecast]),[Product].Generations(6).dimension.members) }’
member [Scenario].[MS1] as ‘AGGREGATE(crossjoin ({[Account4]},crossjoin ({[Market3]},{[Time Period3]})),Scenario.[Act vs Forecast])’, SOLVE_ORDER = 100
select
{ [Scenario].[MS1]
} on columns,
NON EMPTY {{[Evaluate0]}} properties ANCESTOR_NAMES, GEN_NUMBER on rows
from [MyCube_A.MyCube]
+++Administrator:2e0000:2e0040:—-2009/03/27 04:04:14
——————– Query Status: Successful Completion
+++Administrator:2e0000:2e0040:—-2009/03/27 04:04:14
——————– Rows 10, bytes 2720 retrieved from database query id:
+++Administrator:2e0000:2e0040:—-2009/03/27 04:04:14
——————– Physical query response time 0 (seconds), id
+++Administrator:2e0000:2e0040:—-2009/03/27 04:04:14
——————– Physical Query Summary Stats: Number of physical queries 1, Cumulative time 0, DB-connect time 0 (seconds)
+++Administrator:2e0000:2e0040:—-2009/03/27 04:04:14
——————– Rows returned to Client 10
+++Administrator:2e0000:2e0040:—-2009/03/27 04:04:14
——————– Logical Query Summary Stats: Elapsed time 0, Response time 0, Compilation time 0 (seconds)
All is done in less than one second. 10 rows received, 10 rows treated. Nice. Let’s make this MDX dynamically reacting to two different prompts for hierarchy and unit as well as the TopN:
For switching hierarchies:
EVALUATE(‘TopCount(Intersect(Descendants([@{vPromptedHier}{SMU}],6,SELF),%1.dimension.members), @{vPromptedRanking}{10},[Act vs Forecast])’,Product.”Gen8,Product”)
And for switching the actual units:
EVALUATE(‘TopCount(Intersect(Descendants([@{vPromptedSMU}{Business Markets}],5,SELF),%1.dimension.members), @{vPromptedRanking}{10},[Act vs Forecast])’,Product.”Gen8,Product”)
Seems perfect. It does everything I need, is dynamic and flexible enough and is quick. So basically you could stop reading here.
Alas, checking the actual result sets I see some differences between the OBIEE TopN based report and the MDX TopCount based one:
TopCount
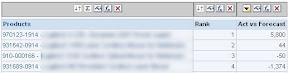 |
TopN
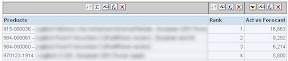 |
The highest in TopCount is only fourth in the TopN while 915-000036, 984-000061 and 984-000061 have been dropped from the TopCount. Finding the reason for this was a bit tedious, but those three members are actually shared members.
My whole product dimension is basically an unbalanced hierarchy. The business hierarchy using the products as its lowest level in generation 7 while the marketing hierarchy uses the products as lowest level in generation 8. Logically inconsistent levels (since the groupings etc. differ) – CHECK. Inconsistent depth (7 vs. 8 generations) – CHECK. With most products being shared members on one branch or the other, this kills TopCount.
I have the feeling that transforming the hierarchy into a ragged one would solve the issue since both branches would end on generation 8 (the target of my MDX).
But let’s continue down the road where we have control over the bits and pieces: I’m waiting on input on the MDX itself from a new service request I raised. But since I still need a viable solution that supports all my requirements and is fast (everything beyond 10 seconds is slow for me).
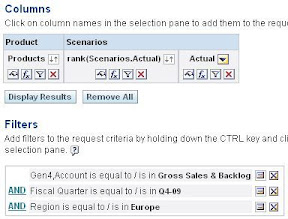
After some trials I meet halfway between the OBIEE and MDX solution:
 |
The “Products” column still holds the MDX:
EVALUATE(‘ORDER(Intersect(%1.dimension.members,Descendants([@{vPromptedSMU}{Business Markets}],5,SELF)), [Act vs Forecast],BDESC)’,Product.”Gen8,Product”)
It now retrieves descendant products of the prompted marketing unit, ordered by actual vs. forecast. This will still retrieve quite some records, but we have the certainty that even shared members are included.
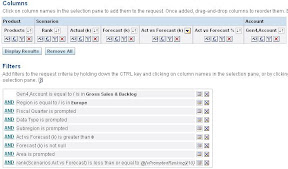
My search for the TopN now happens again over the filters.
rank(Scenarios.Act vs Forecast) is less than or equal to @{vPromptedRanking}{10}
I left all additional calculated members etc. in, so you can see that even with the added payload, this is a way to go. So let’s have a look at the log:
——————– Sending query to database named MyCube Scenarios (id: ):
With
set [Account4] as ‘Filter([Account].Generations(4).members, ([Account].currentmember.MEMBER_ALIAS = “Gross Sales & Backlog” OR [Account].currentmember.MEMBER_Name = “Gross Sales & Backlog”))’
set [Market3] as ‘Filter([Market].Generations(3).members, ([Market].currentmember.MEMBER_ALIAS = “Europe” OR [Market].currentmember.MEMBER_Name = “Europe”))’
set [Evaluate0] as ‘{ORDER(Intersect([Product].Generations(8).dimension.members,Descendants([SMU – Business Markets],5,SELF)), [Act vs Forecast],BDESC) }’
member [Scenario].[MS1] as ‘AGGREGATE({[Market3]},Scenario.[Forecast])’, SOLVE_ORDER = 100
member [Scenario].[MS2] as ‘AGGREGATE({[Market3]},Scenario.[Act vs Forecast])’, SOLVE_ORDER = 100
member [Scenario].[MS3] as ‘AGGREGATE({[Market3]},Scenario.[Act vs Forecast %])’, SOLVE_ORDER = 100
member [Scenario].[MS4] as ‘AGGREGATE({[Market3]},Scenario.[Actual])’, SOLVE_ORDER = 100
select
{ [Scenario].[MS1],
[Scenario].[MS2],
[Scenario].[MS3],
[Scenario].[MS4]
} on columns,
NON EMPTY {crossjoin ({[Account4]},{[Evaluate0]})} properties ANCESTOR_NAMES, GEN_NUMBER on rows
from [MyCube_A.MyCube]
+++Administrator:2e0000:2e006c:—-2009/03/27 05:33:28
——————– Query Status: Successful Completion
+++Administrator:2e0000:2e006c:—-2009/03/27 05:33:28
——————– Rows 603, bytes 342504 retrieved from database query id:
+++Administrator:2e0000:2e006c:—-2009/03/27 05:33:28
——————– Physical query response time 6 (seconds), id
+++Administrator:2e0000:2e006c:—-2009/03/27 05:33:28
——————– Physical Query Summary Stats: Number of physical queries 1, Cumulative time 6, DB-connect time 0 (seconds)
+++Administrator:2e0000:2e006c:—-2009/03/27 05:33:28
——————– Rows returned to Client 10
+++Administrator:2e0000:2e006c:—-2009/03/27 05:33:28
——————– Logical Query Summary Stats: Elapsed time 7, Response time 6, Compilation time 0 (seconds)
6 seconds is an acceptable performance for an interim solution. What’s left now is to replace the normal navigation on dimension members retrieved through the rpd with goURL commands on the column populated by the MDX. Oh yeah…and to hope the service request will give a solution for the Topcount issue with shared members.
Thanks to Pradeesh for sharing the workload and also trying out some of the weirder options I came up with.
End of line.